
All Release Notes
Related information
Version 6.2.3
New features
When viewing a standard Org chart, a new Focus on this node option is available when right-clicking on a node. This option automatically clears all other nodes, leaving only the selected node and its descendants visible.
Changes in Functionality
This release contains no changes to functionality.
Changes to third-party libraries
The Jakarta Servlet version was updated to 6.0.
Closed Issues
This release contains the following closed issues.
Known Issues
This release contains the following known issues:
-
Any saved data model graph based on a duplicated model will refer to the original model and not the duplicated model. Since a saved graph is linked to the XML schema, this behavior is a result of data model duplication not duplicating the schema file name. Embedded models are not affected; only models in modules.
-
If all nodes to expand in a data value graph belong to the same table, the expand service includes the table name. When a table filter is used, the service to expand nodes cannot ascertain the table name to expand. Instead, the following generalized service labels display: Expand targets, Expand sources, Expand children, or Expand parents.
-
After running the Center service on a table, any of its expanded groups are collapsed.
-
Data model graphs are not automatically refreshed to reflect updates to displayed tables and foreign keys.
-
Orphan groups defined at the root of a data model are not displayed in graphs. However, fields defined at this level do display.
-
After resizing a node on a saved graph, the system still displays the default size for the node.
-
Data value graphs do not automatically refresh to reflect updates to displayed data, or nodes.
-
When using the containment type for a self-referencing node, it does not display in the graph.
-
The template configuration cannot be changed at runtime for custom data model graphs—those created using the Java API.
-
In data value graphs, users can move the graph but not graph nodes.
-
On Firefox 52 ESR, performance issues may occur when trying to display a data model graph that includes many tables.
-
Node position is recalculated after expanding. Therefore, node position may change.
-
When a table in a group is hidden, and the group is collapsed, the table's link still displays.
-
Graph templates include the option to show hidden fields, but not hidden tables.
-
Full screen mode is not supported on IE10 or Microsoft Edge.
Version 6.2.2
New features
This release contains the following new features:
-
Team Up ratings, comments, and tags now display as related nodes when using the Display selected data service. Display for each component can be toggled using the graph's filter. For example, you can filter out tags and ratings to display only the comments related to a graph node.
-
The node style was updated to improve the user experience in the Display selected data service. Node backgrounds are now white, with a color-coded bar on the left to show data sources. Previously, nodes used different solid background colors to represent data from different tables.
-
You can now adjust Org chart nodes using 3 preset sizes, or specify a custom height and width. This allows you to change the size to accommodate the node's content.
-
When using the Display data model service, the default template now has display for all model components (except for hidden fields) turned on. You can still enable display of hidden fields by editing the template.
-
When you add an image to a node using the Standard option, the image always uses the Stretch display behavior option. Therefore, the Image display behavior property is no longer available when you select the Standard image type.
-
Performance enhancements:
-
When a user wants to expand nodes that would result in 10 or more nodes expanding, a pop-up displays that allows them to select the nodes to display. Previously, the system would load all available nodes. Now, it only loads the records necessary to populate the pop-up display. Each time a users changes the page, the next batch of records are loaded.
-
The threshold Expanded nodes limit property set in Global properties > Display data using configuration service now also applies to standard Org charts. This update does not impact Org charts in Step by step mode.
-
Retrieval of profiles when sharing a graph was optimized to improve performance.
-
Attention:
As new features are included and the user experience is improved, some screen shots shown in the documentation might not match the UI.
Changes in Functionality
This release contains no changes to functionality.
Changes to third-party libraries
This release contains no changes to third-party libraries.
Closed Issues
This release contains no closed issues.
Known Issues
This release contains the following known issues:
-
DMDV-3484 After expanding a node on a graph generated by the Display data using configuration service, the loading icon displays continuously. This issue only impacts the UI and not add-on functionality.
-
Any saved data model graph based on a duplicated model will refer to the original model and not the duplicated model. Since a saved graph is linked to the XML schema, this behavior is a result of data model duplication not duplicating the schema file name. Embedded models are not affected; only models in modules.
-
If all nodes to expand in a data value graph belong to the same table, the expand service includes the table name. When a table filter is used, the service to expand nodes cannot ascertain the table name to expand. Instead, the following generalized service labels display: Expand targets, Expand sources, Expand children, or Expand parents.
-
After running the Center service on a table, any of its expanded groups are collapsed.
-
Data model graphs are not automatically refreshed to reflect updates to displayed tables and foreign keys.
-
Orphan groups defined at the root of a data model are not displayed in graphs. However, fields defined at this level do display.
-
After resizing a node on a saved graph, the system still displays the default size for the node.
-
Data value graphs do not automatically refresh to reflect updates to displayed data, or nodes.
-
When using the containment type for a self-referencing node, it does not display in the graph.
-
The template configuration cannot be changed at runtime for custom data model graphs—those created using the Java API.
-
In data value graphs, users can move the graph but not graph nodes.
-
On Firefox 52 ESR, performance issues may occur when trying to display a data model graph that includes many tables.
-
Node position is recalculated after expanding. Therefore, node position may change.
-
When a table in a group is hidden, and the group is collapsed, the table's link still displays.
-
Graph templates include the option to show hidden fields, but not hidden tables.
-
Full screen mode is not supported on IE10 or Microsoft Edge.
Version 6.2.1
New features
This release contains the following new features:
-
The styling of standard graphs was updated to enhance user experience. Standard graphs also now have the option to include up to 5 additional fields; two fields can display in the node and the remaining fields can be viewed on the node's tooltip.
-
When selecting a graph configuration, a notification was added to inform users that only one record can be selected for Org chart graphs set to Step by step mode.
-
The default colors for data model graphs were updated. Note that this update does not impact existing template color settings.
-
It is no longer possible to save a graph configuration that includes an invalid input. Instead, an error displays that highlights the issue that must be addressed before saving the graph.
-
The add-on's administrative configuration settings Node styles tab's Org chart style was renamed Additional chart style.
-
You can now configure an EBX® toolbar to automatically display a configured graph. This provides a shortcut for accessing graphs from table and record views.
Attention:
As new features are included and the user experience is improved, some screen shots shown in the documentation might not match the UI.
Changes in Functionality
This release contains no changes to functionality.
Changes to third-party libraries
This release contains no changes to third-party libraries.
Closed Issues
This release contains the following closed issues:
Known Issues
This release contains the following known issues:
-
Any saved data model graph based on a duplicated model will refer to the original model and not the duplicated model. Since a saved graph is linked to the XML schema, this behavior is a result of data model duplication not duplicating the schema file name. Embedded models are not affected; only models in modules.
-
If all nodes to expand in a data value graph belong to the same table, the expand service includes the table name. When a table filter is used, the service to expand nodes cannot ascertain the table name to expand. Instead, the following generalized service labels display: Expand targets, Expand sources, Expand children, or Expand parents.
-
After running the Center service on a table, any of its expanded groups are collapsed.
-
Data model graphs are not automatically refreshed to reflect updates to displayed tables and foreign keys.
-
Orphan groups defined at the root of a data model are not displayed in graphs. However, fields defined at this level do display.
-
After resizing a node on a saved graph, the system still displays the default size for the node.
-
Data value graphs do not automatically refresh to reflect updates to displayed data, or nodes.
-
When using the containment type for a self-referencing node, it does not display in the graph.
-
The template configuration cannot be changed at runtime for custom data model graphs—those created using the Java API.
-
In data value graphs, users can move the graph but not graph nodes.
-
On Firefox 52 ESR, performance issues may occur when trying to display a data model graph that includes many tables.
-
Node position is recalculated after expanding. Therefore, node position may change.
-
When a table in a group is hidden, and the group is collapsed, the table's link still displays.
-
Graph templates include the option to show hidden fields, but not hidden tables.
-
Full screen mode is not supported on IE10 or Microsoft Edge.
Version 6.2.0
New features
This release contains the following new features:
-
Data model graphs now:
-
Display labels of data model components exactly as they are defined in the data model. Previously all labels displayed using lowercase letters.
-
Remove the corresponding links from the data model graph when components are hidden using the graph's Display options.
-
-
Graph configurations now include an option to set permission options for the graph. Permission options specify whether users can use, update, or delete the configuration. Permissions also grant access to the service to export the graph.
-
The quality of exported PDF files was improved.
-
Org chart updates and enhancements:
-
Org charts now include search functionality to search on displayed node labels. Note that this option is not available when using step mode.
-
Default images can be included on Org chart configurations.
-
The image aspect ratio can now be adjusted.
-
The node style background, border color and width, and text color can now be specified as configuration options.
-
A media-type field can now be selected to display digital assets managed in the TIBCO EBX® Digital Asset Manager Add-on.
-
-
When viewing the list of configured data value graphs, users can now hover their mouse over a graph and, if they have sufficient permission, delete the graph.
-
In the API, the
GraphDataTabUIWidgetwas updated with a parameter to specify whether graph nodes are automatically expanded by default.
Attention:
As new features are included and the user experience is improved, some screen shots shown in the documentation might not match the UI.
Changes in Functionality
This release contains no changes to functionality.
Changes to third-party libraries
This release contains no changes to third-party libraries.
Closed Issues
Known Issues
This release contains the following known issues:
-
Any saved data model graph based on a duplicated model will refer to the original model and not the duplicated model. Since a saved graph is linked to the XML schema, this behavior is a result of data model duplication not duplicating the schema file name. Embedded models are not affected; only models in modules.
-
If all nodes to expand in a data value graph belong to the same table, the expand service includes the table name. When a table filter is used, the service to expand nodes cannot ascertain the table name to expand. Instead, the following generalized service labels display: Expand targets, Expand sources, Expand children, or Expand parents.
-
After running the Center service on a table, any of its expanded groups are collapsed.
-
Data model graphs are not automatically refreshed to reflect updates to displayed tables and foreign keys.
-
Orphan groups defined at the root of a data model are not displayed in graphs. However, fields defined at this level do display.
-
After resizing a node on a saved graph, the system still displays the default size for the node.
-
Data value graphs do not automatically refresh to reflect updates to displayed data, or nodes.
-
When using the containment type for a self-referencing node, it does not display in the graph.
-
The template configuration cannot be changed at runtime for custom data model graphs—those created using the Java API.
-
In data value graphs, users can move the graph but not graph nodes.
-
On Firefox 52 ESR, performance issues may occur when trying to display a data model graph that includes many tables.
-
Node position is recalculated after expanding. Therefore, node position may change.
-
When a table in a group is hidden, and the group is collapsed, the table's link still displays.
-
Graph templates include the option to show hidden fields, but not hidden tables.
-
Full screen mode is not supported on IE10 or Microsoft Edge.
Version 6.1.3
New features
This release contains the following new features:
-
Org chart graphs now include:
-
When viewing an Org chart in normal mode, a number now displays at the top of a node to indicate how many immediate children it has.
-
The add-on automatically caps the number of child nodes initially displayed when viewing an Org chart in step mode. The Show more and Show less buttons were added to allow you to increase or decrease the number of child nodes displayed.
-
Up to 5 fields can now display on Org chart tooltips.
-
The default view for an Org chart can now be set outside of the Administration area.
-
-
When staging elements from the add-on a breadcrumb now displays where an element was found and where it is located.
Attention:
As new features are included and the user experience is improved, some screen shots shown in the documentation might not match the UI.
Changes in Functionality
This release contains no changes to functionality.
Changes to third-party libraries
This release contains no changes to third-party libraries.
Closed Issues
This release contains the following closed issues:
-
Org chart The selected node should be focused on the graph after being expanded or collapsed.
Known Issues
This release contains the following known issues:
-
Any saved data model graph based on a duplicated model will refer to the original model and not the duplicated model. Since a saved graph is linked to the XML schema, this behavior is a result of data model duplication not duplicating the schema file name. Embedded models are not affected; only models in modules.
-
If all nodes to expand in a data value graph belong to the same table, the expand service includes the table name. When a table filter is used, the service to expand nodes cannot ascertain the table name to expand. Instead, the following generalized service labels display: Expand targets, Expand sources, Expand children, or Expand parents.
-
After running the Center service on a table, any of its expanded groups are collapsed.
-
Data model graphs are not automatically refreshed to reflect updates to displayed tables and foreign keys.
-
Orphan groups defined at the root of a data model are not displayed in graphs. However, fields defined at this level do display.
-
After resizing a node on a saved graph, the system still displays the default size for the node.
-
Data value graphs do not automatically refresh to reflect updates to displayed data, or nodes.
-
When using the containment type for a self-referencing node, it does not display in the graph.
-
The template configuration cannot be changed at runtime for custom data model graphs—those created using the Java API.
-
In data value graphs, users can move the graph but not graph nodes.
-
On Firefox 52 ESR, performance issues may occur when trying to display a data model graph that includes many tables.
-
Node position is recalculated after expanding. Therefore, node position may change.
-
When a table in a group is hidden, and the group is collapsed, the table's link still displays.
-
Graph templates include the option to show hidden fields, but not hidden tables.
-
Full screen mode is not supported on IE10 or Microsoft Edge.
Version 6.1.2
New features
This release contains the following new features were added to improve Org chart graphs:
-
A new view mode is available. Step by step mode provides a more focused view of an Org chart by displaying only one parent and its immediate children. This view also includes a breadcrumb that tracks as you navigate. You can use the breadcrumb to jump to specific graph nodes. Additionally, a number displays at the top of a node to indicate how many immediate children it has.
-
A tooltip now displays when hovering your mouse over a node. The tooltip includes all fields configured to display in the node.
-
As there are now two view modes available, a default mode can be set in the graph configuration. While viewing the graph, it is possible to right-click on a node and switch between view modes.
Attention:
As new features are included and the user experience is improved, some screen shots shown in the documentation might not match the UI.
Changes in Functionality
This release contains no changes to functionality.
Changes to third-party libraries
This release contains no changes to third-party libraries.
Closed Issues
This release contains the following closed issues:
Known Issues
This release contains the following known issues:
-
Any saved data model graph based on a duplicated model will refer to the original model and not the duplicated model. Since a saved graph is linked to the XML schema, this behavior is a result of data model duplication not duplicating the schema file name. Embedded models are not affected; only models in modules.
-
If all nodes to expand in a data value graph belong to the same table, the expand service includes the table name. When a table filter is used, the service to expand nodes cannot ascertain the table name to expand. Instead, the following generalized service labels display: Expand targets, Expand sources, Expand children, or Expand parents.
-
After running the Center service on a table, any of its expanded groups are collapsed.
-
Data model graphs are not automatically refreshed to reflect updates to displayed tables and foreign keys.
-
Orphan groups defined at the root of a data model are not displayed in graphs. However, fields defined at this level do display.
-
After resizing a node on a saved graph, the system still displays the default size for the node.
-
Data value graphs do not automatically refresh to reflect updates to displayed data, or nodes.
-
When using the containment type for a self-referencing node, it does not display in the graph.
-
The template configuration cannot be changed at runtime for custom data model graphs—those created using the Java API.
-
In data value graphs, users can move the graph but not graph nodes.
-
On Firefox 52 ESR, performance issues may occur when trying to display a data model graph that includes many tables.
-
Node position is recalculated after expanding. Therefore, node position may change.
-
When a table in a group is hidden, and the group is collapsed, the table's link still displays.
-
Graph templates include the option to show hidden fields, but not hidden tables.
-
Full screen mode is not supported on IE10 or Microsoft Edge.
Version 6.1.1
New features
This release contains the following new features:
-
You can now use the Edit graph display service to create and edit org chart configurations.
-
You can now select multiple records when generating org charts.
-
Org charts now include a mini-map to help orient and navigate larger graphs.
Attention:
As new features are included and the user experience is improved, some screen shots shown in the documentation might not match the UI.
Changes in Functionality
This release contains no changes to functionality.
Changes to third-party libraries
The jQuery library was updated to version 3.6.4.
Closed Issues
This release contains the following closed issues:
Known Issues
This release contains the following known issues:
-
Any saved data model graph based on a duplicated model will refer to the original model and not the duplicated model. Since a saved graph is linked to the XML schema, this behavior is a result of data model duplication not duplicating the schema file name. Embedded models are not affected; only models in modules.
-
If all nodes to expand in a data value graph belong to the same table, the expand service includes the table name. When a table filter is used, the service to expand nodes cannot ascertain the table name to expand. Instead, the following generalized service labels display: Expand targets, Expand sources, Expand children, or Expand parents.
-
After running the Center service on a table, any of its expanded groups are collapsed.
-
Data model graphs are not automatically refreshed to reflect updates to displayed tables and foreign keys.
-
Orphan groups defined at the root of a data model are not displayed in graphs. However, fields defined at this level do display.
-
After resizing a node on a saved graph, the system still displays the default size for the node.
-
Data value graphs do not automatically refresh to reflect updates to displayed data, or nodes.
-
When using the containment type for a self-referencing node, it does not display in the graph.
-
The template configuration cannot be changed at runtime for custom data model graphs—those created using the Java API.
-
In data value graphs, users can move the graph but not graph nodes.
-
On Firefox 52 ESR, performance issues may occur when trying to display a data model graph that includes many tables.
-
Node position is recalculated after expanding. Therefore, node position may change.
-
When a table in a group is hidden, and the group is collapsed, the table's link still displays.
-
Graph templates include the option to show hidden fields, but not hidden tables.
-
Full screen mode is not supported on IE10 or Microsoft Edge.
Version 6.1.0
Released: March 2023
New features
This release contains the following new features:
-
To improve performance, the number of records that display when expanding a node is now limited. By default, the limit is set to 2000. Administrators can lower this limit, but not increase it. This option applies to the Display data using configuration and Display selected data services.
-
The add-on was updated to ensure compatibility with the following TIBCO EBX® features:
-
The EBX® staging feature allows you to migrate configuration settings from one environment to another. See the EBX® product documentation for additional details.
-
EBX® has updated the way it handles URL encoding. See the EBX® release notes for additional information.
-
-
When creating a data value graph configuration, the Org chart type is now available to select. This type of graph is optimized for displaying data in a tree-like fashion with a clear top-down structure.
-
In addition to showing all links in a data model graph, you can now hide all links.
-
After saving a new data model graph, the name now displays as part of the screen's breadcrumb.
Attention:
As new features are included and the user experience is improved, some screen shots shown in the documentation might not match the UI.
Changes in Functionality
When hiding child dataspaces, the data model definition is now used. All child dataspaces are now hidden, not just those from the selected dataspace.
Changes to third-party libraries
This release contains no changes to third-party libraries.
Closed Issues
This release contains the following closed issues:
Known Issues
This release contains the following known issues:
-
Any saved data model graph based on a duplicated model will refer to the original model and not the duplicated model. Since a saved graph is linked to the XML schema, this behavior is a result of data model duplication not duplicating the schema file name. Embedded models are not affected; only models in modules.
-
If all nodes to expand in a data value graph belong to the same table, the expand service includes the table name. When a table filter is used, the service to expand nodes cannot ascertain the table name to expand. Instead, the following generalized service labels display: Expand targets, Expand sources, Expand children, or Expand parents.
-
After running the Center service on a table, any of its expanded groups are collapsed.
-
Data model graphs are not automatically refreshed to reflect updates to displayed tables and foreign keys.
-
Orphan groups defined at the root of a data model are not displayed in graphs. However, fields defined at this level do display.
-
After resizing a node on a saved graph, the system still displays the default size for the node.
-
Data value graphs do not automatically refresh to reflect updates to displayed data, or nodes.
-
When using the containment type for a self-referencing node, it does not display in the graph.
-
The template configuration cannot be changed at runtime for custom data model graphs—those created using the Java API.
-
In data value graphs, users can move the graph but not graph nodes.
-
On Firefox 52 ESR, performance issues may occur when trying to display a data model graph that includes many tables.
-
Node position is recalculated after expanding. Therefore, node position may change.
-
When a table in a group is hidden, and the group is collapsed, the table's link still displays.
-
Graph templates include the option to show hidden fields, but not hidden tables.
-
Full screen mode is not supported on IE10 or Microsoft Edge.
Version 2.5.1
Released: February 2023
New features
This release was updated to ensure compatibility with the TIBCO EBX® Add-ons Bundle version 5.6.1.
Changes in Functionality
This release contains no changes in functionality.
Changes to third-party libraries
This release contains no changes to third-party libraries.
Closed Issues
This release contains no closed issues.
Known Issues
This release contains the following known issues:
-
Any saved data model graph based on a duplicated model will refer to the original model and not the duplicated model. Since a saved graph is linked to the XML schema, this behavior is a result of data model duplication not duplicating the schema file name. Embedded models are not affected; only models in modules.
-
If all nodes to expand in a data value graph belong to the same table, the expand service includes the table name. When a table filter is used, the service to expand nodes cannot ascertain the table name to expand. Instead, the following generalized service labels display: Expand targets, Expand sources, Expand children, or Expand parents.
-
After running the Center service on a table, any of its expanded groups are collapsed.
-
Data model graphs are not automatically refreshed to reflect updates to displayed tables and foreign keys.
-
Orphan groups defined at the root of a data model are not displayed in graphs. However, fields defined at this level do display.
-
After resizing a node on a saved graph, the system still displays the default size for the node.
-
Data value graphs do not automatically refresh to reflect updates to displayed data, or nodes.
-
When using the containment type for a self-referencing node, it does not display in the graph.
-
The template configuration cannot be changed at runtime for custom data model graphs—those created using the Java API.
-
In data value graphs, users can move the graph but not graph nodes.
-
On Firefox 52 ESR, performance issues may occur when trying to display a data model graph that includes many tables.
-
Node position is recalculated after expanding. Therefore, node position may change.
-
When a table in a group is hidden, and the group is collapsed, the table's link still displays.
-
Graph templates include the option to show hidden fields, but not hidden tables.
-
Full screen mode is not supported on IE10 or Microsoft Edge.
Version 2.5.0
Released: September 2022
New features
Data model graph updates:
-
The following options can be set to show or hide in a data model graph: computed attributes, hidden fields, inherited fields, associations, and linked fields.
-
Options are available to show and hide relationship links in the graph.
-
After saving updates to data model graph you are no longer directed away from the graph.
-
The save and load options are available on data model graphs launched from the DMA.
The number of selectable records when running the Display selected data and Display data using configuration services can be limited using the properties in the Global properties and options group. This option helps prevent performance issues by limiting the number of nodes generated when initializing a graph.
A limit can be set on the number of child nodes that automatically display when expanding a parent. The limit is set with the Threshold for node selection property when configuring a data value graph.
There is an option on graphs generated using the Display selected data service to toggle display of nodes from child dataspaces.
Changes in Functionality
This release contains no changes in functionality.
Changes to third-party libraries
This release contains no changes to third-party libraries.
Closed Issues
This release contains the following closed issues:
Known Issues
This release contains the following known issues:
-
Any saved data model graph based on a duplicated model will refer to the original model and not the duplicated model. Since a saved graph is linked to the XML schema, this behavior is a result of data model duplication not duplicating the schema file name. Embedded models are not affected; only models in modules.
-
If all nodes to expand in a data value graph belong to the same table, the expand service includes the table name. When a table filter is used, the service to expand nodes cannot ascertain the table name to expand. Instead, the following generalized service labels display: Expand targets, Expand sources, Expand children, or Expand parents.
-
After running the Center service on a table, any of its expanded groups are collapsed.
-
Data model graphs are not automatically refreshed to reflect updates to displayed tables and foreign keys.
-
Orphan groups defined at the root of a data model are not displayed in graphs. However, fields defined at this level do display.
-
After resizing a node on a saved graph, the system still displays the default size for the node.
-
Data value graphs do not automatically refresh to reflect updates to displayed data, or nodes.
-
When using the containment type for a self-referencing node, it does not display in the graph.
-
The template configuration cannot be changed at runtime for custom data model graphs—those created using the Java API.
-
In data value graphs, users can move the graph but not graph nodes.
-
On Firefox 52 ESR, performance issues may occur when trying to display a data model graph that includes many tables.
-
Node position is recalculated after expanding. Therefore, node position may change.
-
When a table in a group is hidden, and the group is collapsed, the table's link still displays.
-
Graph templates include the option to show hidden fields, but not hidden tables.
-
Full screen mode is not supported on IE10 or Microsoft Edge.
Version 2.4.0
Released: June 2022
New features
The add-on's logs were updated to improve the level of information provided.
Changes in Functionality
This release contains no changes in functionality.
Changes to third-party libraries
This release contains no changes to third-party libraries.
Closed Issues
The following known issue was removed: When you deploy the TIBCO EBX® Data Model and Data Visualization Add-on, you must also deploy the TIBCO EBX® Digital Asset Manager Add-on.
Known Issues
This release contains the following known issues:
-
Any saved data model graph based on a duplicated model will refer to the original model and not the duplicated model. Since a saved graph is linked to the XML schema, this behavior is a result of data model duplication not duplicating the schema file name. Embedded models are not affected; only models in modules.
-
If all nodes to expand in a data value graph belong to the same table, the expand service includes the table name. When a table filter is used, the service to expand nodes cannot ascertain the table name to expand. Instead, the following generalized service labels display: Expand targets, Expand sources, Expand children, or Expand parents.
-
After running the Center service on a table, any of its expanded groups are collapsed.
-
Data model graphs are not automatically refreshed to reflect updates to displayed tables and foreign keys.
-
Orphan groups defined at the root of a data model are not displayed in graphs. However, fields defined at this level do display.
-
After resizing a node on a saved graph, the system still displays the default size for the node.
-
Data value graphs do not automatically refresh to reflect updates to displayed data, or nodes.
-
When using the containment type for a self-referencing node, it does not display in the graph.
-
The template configuration cannot be changed at runtime for custom data model graphs—those created using the Java API.
-
In data value graphs, users can move the graph but not graph nodes.
-
On Firefox 52 ESR, performance issues may occur when trying to display a data model graph that includes many tables.
-
Node position is recalculated after expanding. Therefore, node position may change.
-
When a table in a group is hidden, and the group is collapsed, the table's link still displays.
-
Graph templates include the option to show hidden fields, but not hidden tables.
-
Full screen mode is not supported on IE10 or Microsoft Edge.
Version 2.3.2
Released: April 2022
New features
This release includes no new features.
Changes in Functionality
Updates were made to ensure compatibility the TIBCO EBX 6.0.6 GA release.
Changes to third-party libraries
This release contains no changes to third-party libraries.
Closed Issues
This release contains no closed issues.
Known Issues
This release contains the following known issues:
-
When you deploy the TIBCO EBX® Data Model and Data Visualization Add-on, you must also deploy the TIBCO EBX® Digital Asset Manager Add-on.
-
Any saved data model graph based on a duplicated model will refer to the original model and not the duplicated model. Since a saved graph is linked to the XML schema, this behavior is a result of data model duplication not duplicating the schema file name. Embedded models are not affected; only models in modules.
-
If all nodes to expand in a data value graph belong to the same table, the expand service includes the table name. When a table filter is used, the service to expand nodes cannot ascertain the table name to expand. Instead, the following generalized service labels display: Expand targets, Expand sources, Expand children, or Expand parents.
-
After running the Center service on a table, any of its expanded groups are collapsed.
-
Data model graphs are not automatically refreshed to reflect updates to displayed tables and foreign keys.
-
Orphan groups defined at the root of a data model are not displayed in graphs. However, fields defined at this level do display.
-
After resizing a node on a saved graph, the system still displays the default size for the node.
-
Data value graphs do not automatically refresh to reflect updates to displayed data, or nodes.
-
When using the containment type for a self-referencing node, it does not display in the graph.
-
The template configuration cannot be changed at runtime for custom data model graphs—those created using the Java API.
-
In data value graphs, users can move the graph but not graph nodes.
-
On Firefox 52 ESR, performance issues may occur when trying to display a data model graph that includes many tables.
-
Node position is recalculated after expanding. Therefore, node position may change.
-
When a table in a group is hidden, and the group is collapsed, the table's link still displays.
-
Graph templates include the option to show hidden fields, but not hidden tables.
-
Full screen mode is not supported on IE10 or Microsoft Edge.
Version 2.3.1
Released: March 2022
New features
This release includes no new features.
Changes in Functionality
This release contains no changes in functionality.
Changes to third-party libraries
The jQuery library was updated to version 3.6.0.
Closed Issues
Known Issues
This release contains the following known issues:
-
When you deploy the TIBCO EBX® Data Model and Data Visualization Add-on, you must also deploy the TIBCO EBX® Digital Asset Manager Add-on.
-
Any saved data model graph based on a duplicated model will refer to the original model and not the duplicated model. Since a saved graph is linked to the XML schema, this behavior is a result of data model duplication not duplicating the schema file name. Embedded models are not affected; only models in modules.
-
If all nodes to expand in a data value graph belong to the same table, the expand service includes the table name. When a table filter is used, the service to expand nodes cannot ascertain the table name to expand. Instead, the following generalized service labels display: Expand targets, Expand sources, Expand children, or Expand parents.
-
After running the Center service on a table, any of its expanded groups are collapsed.
-
Data model graphs are not automatically refreshed to reflect updates to displayed tables and foreign keys.
-
Orphan groups defined at the root of a data model are not displayed in graphs. However, fields defined at this level do display.
-
After resizing a node on a saved graph, the system still displays the default size for the node.
-
Data value graphs do not automatically refresh to reflect updates to displayed data, or nodes.
-
When using the containment type for a self-referencing node, it does not display in the graph.
-
The template configuration cannot be changed at runtime for custom data model graphs—those created using the Java API.
-
In data value graphs, users can move the graph but not graph nodes.
-
On Firefox 52 ESR, performance issues may occur when trying to display a data model graph that includes many tables.
-
Node position is recalculated after expanding. Therefore, node position may change.
-
When a table in a group is hidden, and the group is collapsed, the table's link still displays.
-
Graph templates include the option to show hidden fields, but not hidden tables.
-
Full screen mode is not supported on IE10 or Microsoft Edge.
Version 2.3.0
Released: February 2022
New features
This release includes the following new features:
-
The Display selected data service has a new default grid layout. This layout positions graph nodes in rows and columns with a given node's parent node on the left and child node on the right. You can toggle the grid mode on and off. Regardless of whether the grid mode is selected, you can still drag and drop nodes to rearrange them in a graph.
-
The new Label Maximum Length property in a graph's Link style tab allows you to define the maximum length of link labels. Labels that exceed the limit are truncated. You can view the full label by hovering your mouse over it.
Changes in Functionality
This release contains the following changes in functionality:
-
When selecting a graph configuration to display, the names of existing graphs now display in alphabetical order.
-
The labels of highlighted links now display according to the Highlight color option's settings.
-
The message displayed when a graph is taking too long to generate was updated to be more informative.
Changes to third-party libraries
This release contains no changes to third party libraries.
Closed Issues
This release contains the following closed issues:
Known Issues
This release contains the following known issues:
-
When you deploy the TIBCO EBX® Data Model and Data Visualization Add-on, you must also deploy the TIBCO EBX® Digital Asset Manager Add-on. Otherwise, some features are inaccessible.
-
Any saved data model graph based on a duplicated model will refer to the original model and not the duplicated model. Since a saved graph is linked to the XML schema, this behavior is a result of data model duplication not duplicating the schema file name. Embedded models are not affected; only models in modules.
-
If all nodes to expand in a data value graph belong to the same table, the expand service includes the table name. When a table filter is used, the service to expand nodes cannot ascertain the table name to expand. Instead, the following generalized service labels display: Expand targets, Expand sources, Expand children, or Expand parents.
-
After running the Center service on a table, any of its expanded groups are collapsed.
-
Data model graphs are not automatically refreshed to reflect updates to displayed tables and foreign keys.
-
Orphan groups defined at the root of a data model are not displayed in graphs. However, fields defined at this level do display.
-
After resizing a node on a saved graph, the system still displays the default size for the node.
-
Data value graphs do not automatically refresh to reflect updates to displayed data, or nodes.
-
When using the containment type for a self-referencing node, it does not display in the graph.
-
The template configuration cannot be changed at runtime for custom data model graphs—those created using the Java API.
-
In data value graphs, users can move the graph but not graph nodes.
-
On Firefox 52 ESR, performance issues may occur when trying to display a data model graph that includes many tables.
-
Node position is recalculated after expanding. Therefore, node position may change.
-
When a table in a group is hidden, and the group is collapsed, the table's link still displays.
-
Graph templates include the option to show hidden fields, but not hidden tables.
-
Full screen mode is not supported on IE10 or Microsoft Edge.
Version 2.2.0
Released: November 2021
New features
This release includes the following new features:
-
The way data model names display in the add-on was updated to improve readability.
-
The manner in which a graph displays when opened was updated to improve the overall feel.
-
You can now change the node shape and order in which nodes display for configured data value graphs.
-
A search feature was added to the pop-up where you select additional nodes to display in data value graphs.
Changes in Functionality
This release contains no changes in functionality.
Changes to third-party libraries
This release contains no changes to third party libraries.
Closed Issues
This release contains the following closed issues:
Known Issues
This release contains the following known issues:
-
When you deploy the TIBCO EBX® Data Model and Data Visualization Add-on, you must also deploy the TIBCO EBX® Digital Asset Manager Add-on. Otherwise, some features are inaccessible.
-
Any saved data model graph based on a duplicated model will refer to the original model and not the duplicated model. Since a saved graph is linked to the XML schema, this behavior is a result of data model duplication not duplicating the schema file name. Embedded models are not affected; only models in modules.
-
If all nodes to expand in a data value graph belong to the same table, the expand service includes the table name. When a table filter is used, the service to expand nodes cannot ascertain the table name to expand. Instead, the following generalized service labels display: Expand targets, Expand sources, Expand children, or Expand parents.
-
After running the Center service on a table, any of its expanded groups are collapsed.
-
Data model graphs are not automatically refreshed to reflect updates to displayed tables and foreign keys.
-
Orphan groups defined at the root of a data model are not displayed in graphs. However, fields defined at this level do display.
-
After resizing a node on a saved graph, the system still displays the default size for the node.
-
Data value graphs do not automatically refresh to reflect updates to displayed data, or nodes.
-
When using the containment type for a self-referencing node, it does not display in the graph.
-
The template configuration cannot be changed at runtime for custom data model graphs—those created using the Java API.
-
In data value graphs, users can move the graph but not graph nodes.
-
On Firefox 52 ESR, performance issues may occur when trying to display a data model graph that includes many tables.
-
Node position is recalculated after expanding. Therefore, node position may change.
-
When a table in a group is hidden, and the group is collapsed, the table's link still displays.
-
Graph templates include the option to show hidden fields, but not hidden tables.
-
Full screen mode is not supported on IE10 or Microsoft Edge.
Version 2.1.0
Released: June 2021
New features
This release includes the following new features:
-
When viewing a data model graph, the search scope in the filter pane now includes fields. It also now automatically pares down display of data model elements containing the filter text as you type.
-
In graphs generated using the Display selected data service:
-
The filter pane now allows you to search for data values contained in the graph. The list of data model elements is reduced as you type to only show those elements that contain the value you are searching for.
-
The number of nodes available to open displays below node labels. When there are 10 or more node available, a table icon displays. Clicking the icon displays a list of records and allows you to select those that you want to display.
-
-
In graphs generated using the Display data using configuration service:
-
The filter pane now allows you to search for data values contained in the graph. The list of data model elements is reduced as you type to only show those elements that contain the value you are searching for.
-
When opening the context menu to display related nodes, the number of available nodes is included. If 10 or more nodes are available when you expand related nodes, a pop-up displays and allows you to select the nodes you want to display.
-
Changes in Functionality
This release contains no changes in functionality.
Changes to third-party libraries
This release contains no changes to third party libraries.
Closed Issues
Known Issues
This release contains the following known issues:
-
Any saved data model graph based on a duplicated model will refer to the original model and not the duplicated model. Since a saved graph is linked to the XML schema, this behavior is a result of data model duplication not duplicating the schema file name. Embedded models are not affected; only models in modules.
-
If all nodes to expand in a data value graph belong to the same table, the expand service includes the table name. When a table filter is used, the service to expand nodes cannot ascertain the table name to expand. Instead, the following generalized service labels display: Expand targets, Expand sources, Expand children, or Expand parents.
-
After running the Center service on a table, any of its expanded groups are collapsed.
-
Data model graphs are not automatically refreshed to reflect updates to displayed tables and foreign keys.
-
Orphan groups defined at the root of a data model are not displayed in graphs. However, fields defined at this level do display.
-
After resizing a node on a saved graph, the system still displays the default size for the node.
-
Data value graphs do not automatically refresh to reflect updates to displayed data, or nodes.
-
When using the containment type for a self-referencing node, it does not display in the graph.
-
The template configuration cannot be changed at runtime for custom data model graphs—those created using the Java API.
-
In data value graphs, users can move the graph but not graph nodes.
-
On Firefox 52 ESR, performance issues may occur when trying to display a data model graph that includes many tables.
-
Node position is recalculated after expanding. Therefore, node position may change.
-
When a table in a group is hidden, and the group is collapsed, the table's link still displays.
-
Graph templates include the option to show hidden fields, but not hidden tables.
-
Full screen mode is not supported on IE10 or Microsoft Edge.
Version 2.0.1
Release Date: May 2021
Bug fixes
The following issues were fixed in this release:
Deployment note
Attention:
When you deploy the TIBCO EBX® Data Model and Data Visualization Add-on, you must also deploy the TIBCO EBX® Digital Asset Manager Add-on. Otherwise, some features are inaccessible.
Version 2.0.0
Release Date: March 2021
Data value graphs
Data value graphs in this release contain the following new features and updates:
-
A visual editor is now available to create and edit data value and relationship graphs. The editor allows you to drag-and-drop to add tables and relationships to a graph. The editor provides the following enhancements and advantages over manual graph creation:
-
You get immediate visual feedback on changes to the configuration.
-
The add-on automatically handles the creation of settings required to add tables, create links to display relationships, and setting options to customize display.
-
The editor is accessible from a table even when no graph exists. This prevents you from having to navigate in EBX® to the Administration panel in the Advanced perspective to create a new graph.
The following image shows the new editor: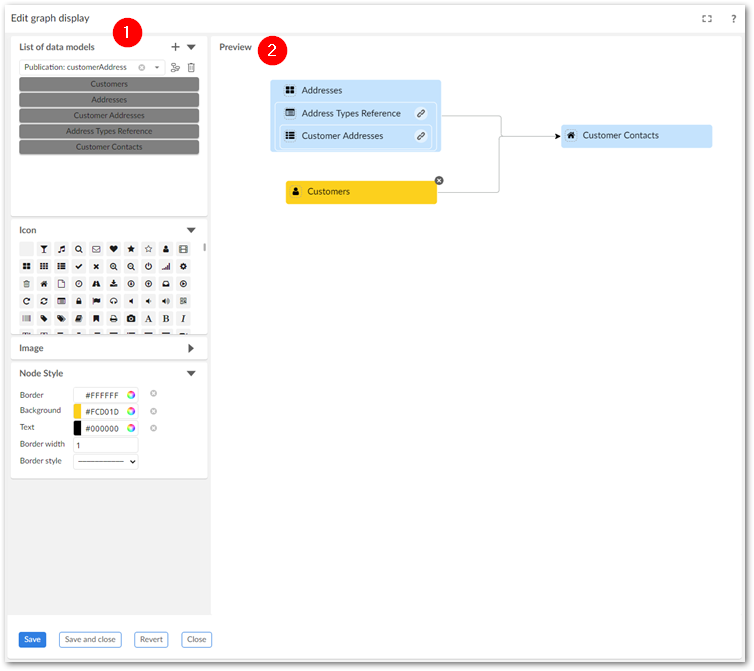
-
|
1)
|
Use the panel on the left-hand side to add and change the appearance of graph elements. For example, you can drag a table from left-to-right to add it to the graph.
|
|
2)
|
The Preview pane provides real-time visual feedback and allows you to: add and remove relationships, remove tables, open a detailed view of the table configuration.
|
For more information on using the editor, see Quick start.
-
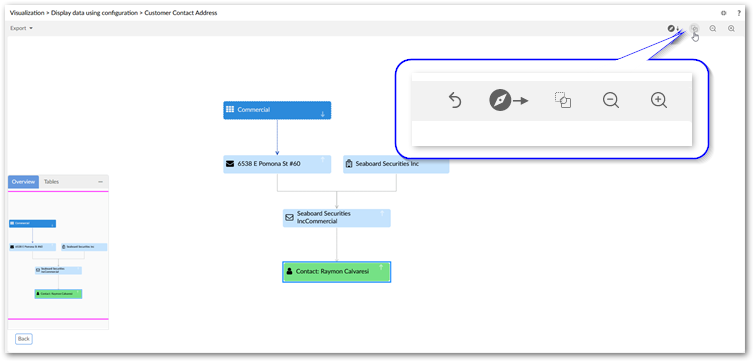
When viewing a data value graph, you can now change configuration settings using the new editor (described above). As shown below, you can access the editor by selecting the highlighted icon.
-
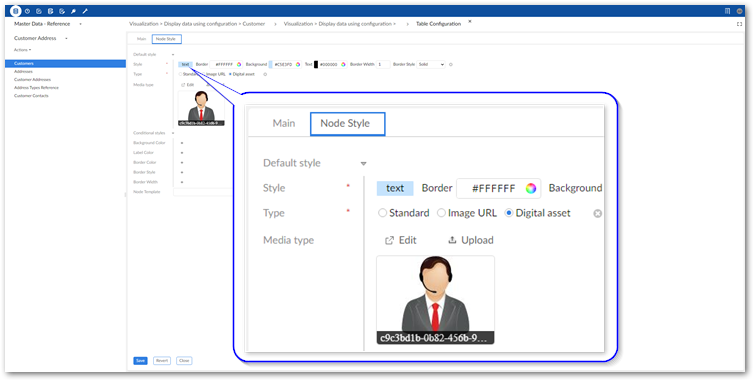
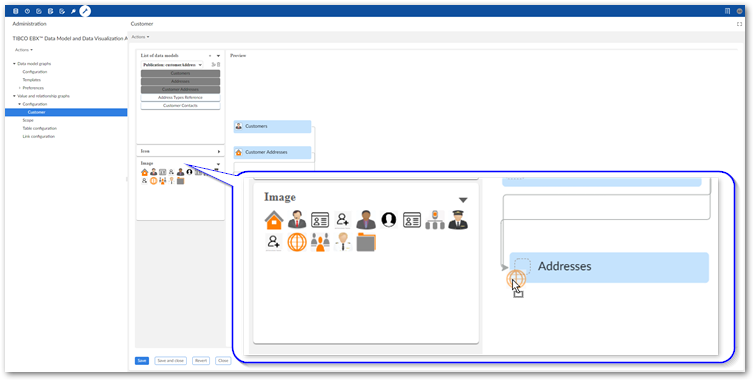
You can now display digital assets managed by the TIBCO EBX® Digital Asset Manager Add-on on data value graph nodes. See Displaying digital assets on nodes.You can add an asset from the following screens:
-
A table configuration's Node style tab:
-
By dragging from the Image palate in the graphical editor:
-
-
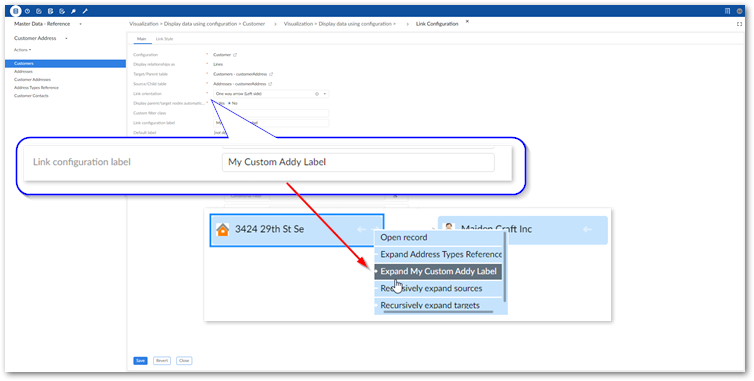
A new link configuration option allows you to set the label that displays in a node's context menu. This property is optional and if you do not specify a custom label, the label of the table that will be expanded displays.
-
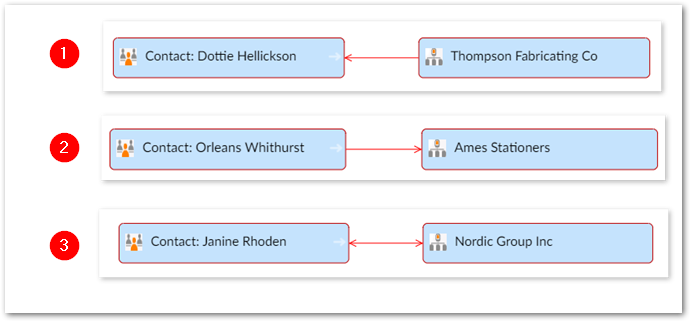
When displaying relationships as lines, you can now set an arrow direction to meet business requirements. Use a link configuration's Link orientation option to set the following options:
|
1)
|
Set to One way arrow (Left side).
|
|
2)
|
Set to One way arrow (Right side).
|
|
3)
|
Set to Two way arrow.
|
All graph types
This release contains the following new features:
-
All graphs now have an undo option. Note that a history of actions is not maintained. This option only rolls back the most recent change to a graph.
-
Graphs can now display TIBCO EBX® associations over foreign keys, link tables, and XPath. In data model graphs you can choose the colors used to display the different association types.
Deprecated APIs
The
isDisplayed() method was removed from the NodeContext class.
Version 1.4.6
Released: February 2021
Bug fixes
Release Notes 1.4.5
Released: January 2021
Changes and updates
The following libraries were updated in this release:
-
Apache Standard TagLib library to version 1.2.3.
-
Spring framework library to version 5.2.9.
-
Jackson databind library to version 2.11.2.
Bug fixes
Release Notes 1.4.4
Release Date: October 20, 2020
Bug fixes
Release Notes 1.4.3
Release Date: September 18, 2020
Bug fixes
Release Notes 1.4.2
Release Date: June 23, 2020
Updates and changes
The jQuery and Jackson Databind libraries were updated and the SLF4J library was removed.
Release Notes 1.4.1
Release Date: April 20, 2020
Bug fixes
Release Notes 1.4.0
Release Date: February 20, 2020
New features
The sections below highlight new in this release:
New data model graph features
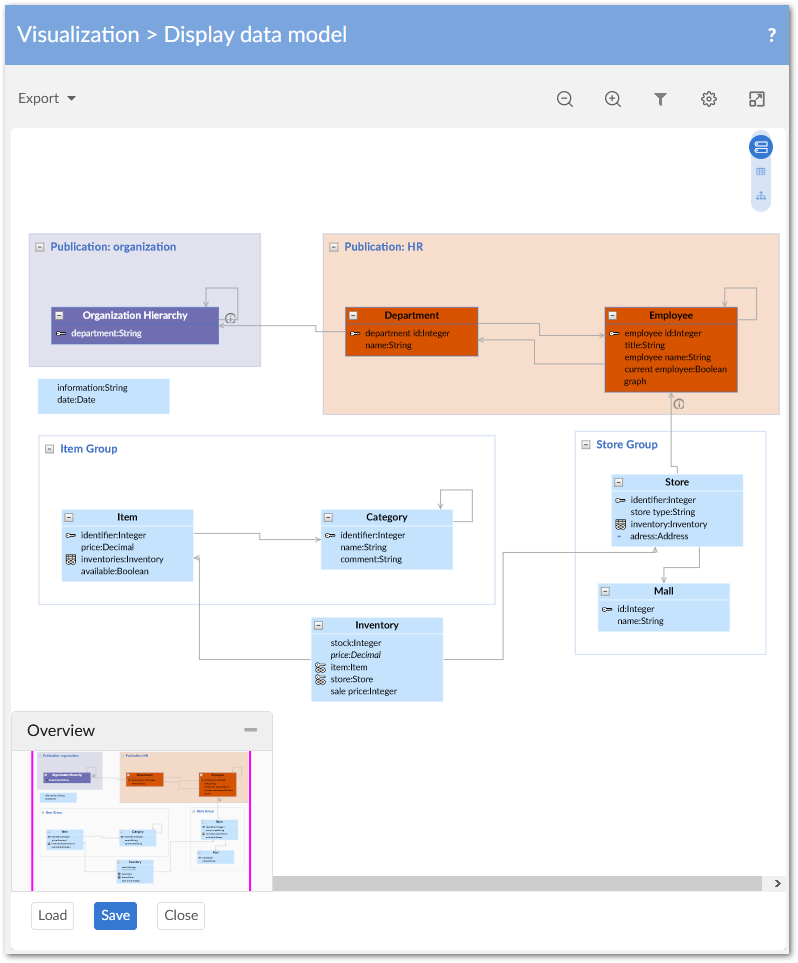
Data model graphs can now display multiple data models. When a graph includes a table from an outside data model, users can right-click to select the Display external model service. Each outside data model displays using alternate colors to differentiate between them. Normal graph interaction is available when displaying multiple models. For example, users can apply templates to change appearance, re-arrange, filter, save and share the graphs. An additional feature for graphs containing multiple models is the level selector. This allows users to change the level of the graphs detail to: Field, Table, or Model. Choosing a level expands graph components to the selected level of detail and automatically resizes the graph.
The following image shows a data model graph with external models shaded and the base data model highlighted like a group:
Filter pane and table selection
The data model filter pane and table selection screens have been updated with:
-
Options to display and hide external data models.
-
An
 icon to indicate that a graph is displaying a table from an outside model, but the model is hidden.
-
Tabs that contain all, displayed, and hidden tables and data models.
New data value graph features
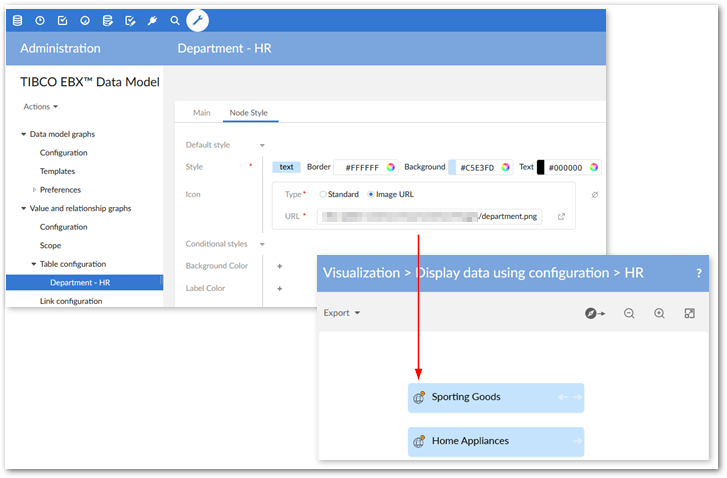
In addition to the option of adding one of the icons provided with the add-on, you can now update a table node style to include a custom icon. This functionality is provided through the new Image URL option when viewing a configured table's Node Style tab. The URL must point to an image located in the same domain as TIBCO EBX®.
The following image shows an example of adding a custom image to a node with a URL:
Attention:
Saved data model graphs from previous add-on versions cannot be migrated and will be deleted.
Release Notes 1.3.0
Release Date: November 8, 2019
New features
The sections below highlight new in this release:
New graph features
The following updates have been made to graph functionality:
-
Administrators can set a new configuration option to automatically expand child and source nodes to display their respective parents and targets. When enabled, the add-on automatically expands nodes on graph open or when a user expands an existing node to display these child/source nodes.
-
As shown below, when viewing data value and relationship graphs, users can now change node shapes:
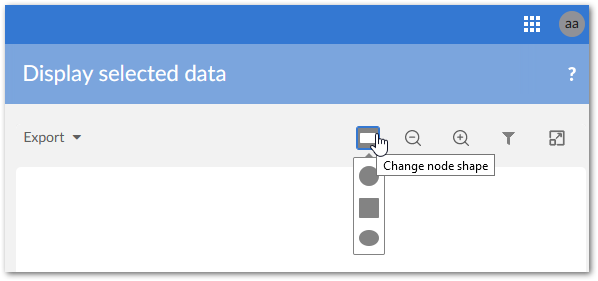
-
To improve the feel of the interface, the tooltip design has been updated and as shown below, graph button display locations have been changed:
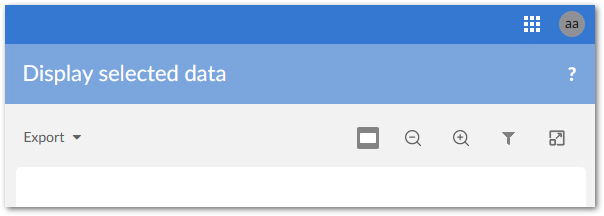
API features
This release contains the following new and updated API features:
-
A custom service can now be written using the add-on's API to display a default data value graph based on record selection. See Displaying a default data value graph for a sample implementation.
-
Data value graph features including, but not limited to, Overview box display, access to detailed record views, and availability of contextual menu options can be enabled/disabled. The new
GraphDataFeaturesenumerates available features.
Bug Fixes
Release Notes 1.2.1
Release Date: August 6, 2019
Bug Fixes
Release Notes 1.2.0
Release Date: June 20, 2019
New features and enhancements
This release contains the following new features:
-
The Display data model graph service is now available to run when viewing a data model in the Data Modeler Assistant area.
-
By default, the ability to view a data value and relationship graph no longer requires configuration. The new Display selected data service is available from table Actions menus. Selected records and relationships display using default settings. In addition to standard navigation and export features, users can search for and toggle display of nodes and relationships. See Default graphs for more information.The following image highlights some of the default features:
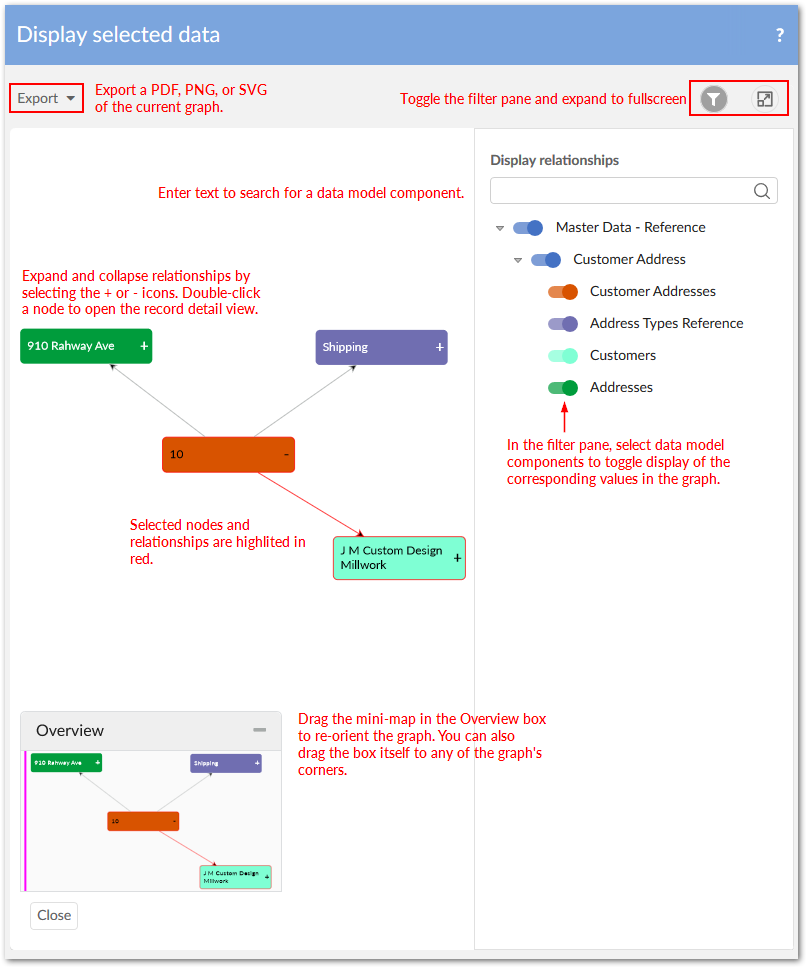
-
Data value graph services can now be called from a perspective or workflow. See Graphs in perspectives and workflows for more information.
-
The API now allows you to create custom node templates that determine node appearance. Customizable node components include, but are not limited to, images and data tables. See Node templates for more information.The following image provides an example of a custom node:
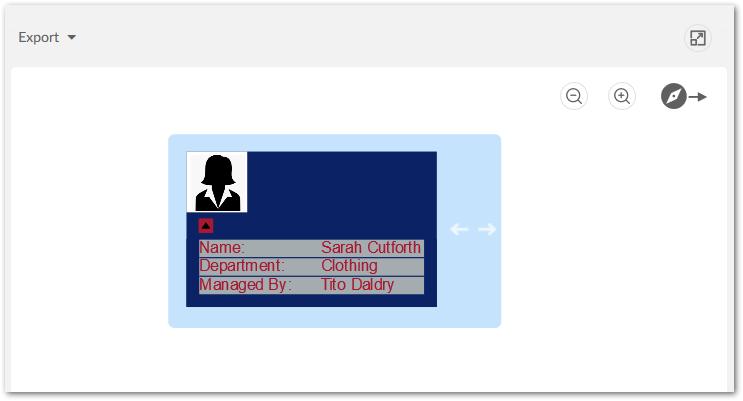
Release Notes 1.1.0
Release Date: February 22, 2019
New features and enhancements
This release contains the following new features:
-
Data value graph orientation has been updated. When administrators configure or users view a graph, they can specify that nodes display: Left-to-right, Right-to-left, Top-down, or Bottom-up.
-
Dynamic labels can now be defined for data value graph nodes and links. The following types of labels can be defined:
-
Default: Label text can be directly entered, or data model elements selected. Labels based on data model elements automatically update based on changes to the associated value.
-
Localized: In addition to sharing the same features as default labels, these labels can leverage the EBX® localization feature.
-
Programmatic: Label definitions can be implemented in a Java class.
-
-
Node and link styles can now be based on the evaluation of an XPath expression. For example, you could specify that all graph nodes that refer to an employee with a status of inactive are colored red. You can also use a Java class to define programmatic styles for links.
-
Links and their corresponding values can now be filtered out of data value graphs. A conditional filter is used for each defined foreign key in the graph. If the filter evaluates to true, the relationship is removed.
-
Data model graphs can now be shared with other users.
Known limitations
This release contains the following known limitations:
-
The indicator and node label position are incorrect when expanded with many containment levels.
-
When using a curved line to display a link, the arrow doesn't exactly align with the line.
Bug Fixes
This release contains the following bug fixes:
Release Notes 1.0.2
Release Date: January 11, 2019
Bug fixes
Release Notes 1.0.1
Release Date: December 3, 2018
Bug fixes
This release contains the following bug fixes:
Release Notes 1.0.0
Release Date: October 26, 2018
Overview of features
By generating interactive graphs of your data, relationships, and data structure, the EBX Data Model and Data Visualization Add-on allows you to:
-
View data structure by rendering data model graphs. Data model graphs are not limited to EBX® data sources. Using the API, graphs can be generated from external sources.
-
View data values and relationships by rendering graphs that show selected values and their relationships.
The following sections highlight additional features and functionality of the EBX Data Model and Data Visualization Add-on.
Data model graphs
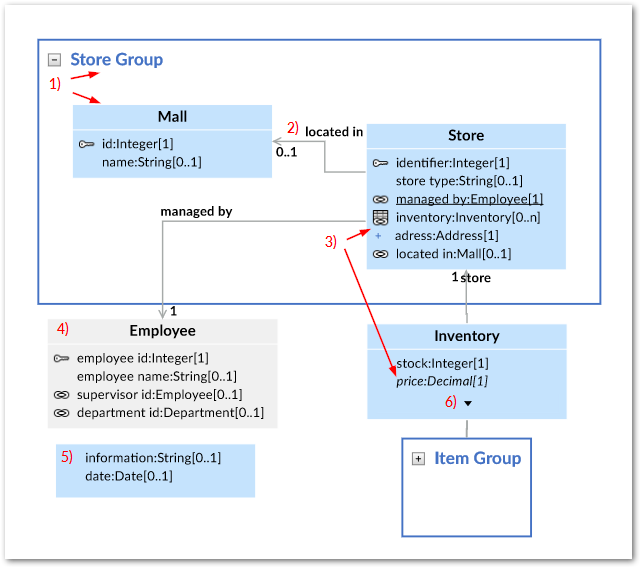
By default, no configuration is required to display data model graphs. You can display a graph by running the Display data model service from a table or dataset Actions menu. What displays in a graph depends on the model content from which it was generated and the template settings. The following image and table describe data model graph components.
|
1) Groups and Tables
|
A box is automatically drawn around components included in a group. You can collapse, expand, re-size and rearrange groups. The bottom-right corner of the images shows a collapsed group. Tables display their labels and fields. Standard DMA icons are used to indicate keys and relationships.
|
|
2) Relationships
|
Arrows indicate foreign key relationships and their direction. The labels correspond to each foreign key field.
|
|
3) Underlined field, plus icon, and italic fields.
|
An underlined field belongs to a table located outside of the current dataset. The plus icon next to a field indicates you can expand to display more information, such as fields included in a complex type. Fields in italics represent inherited fields.
|
|
4) Table located outside of the current dataset
|
When a table is located outside of the current dataset, it will be shaded in the graph. The color of the shade is editable in the template.
|
|
5) Orphan fields
|
Fields that are not part of a table display without a title.
|
|
6) Display additional fields
|
When a table holds more fields than can display, use the arrow icon to expand/collapse.
|
For more information on interacting with data model graphs, see Interacting with data model graphs.
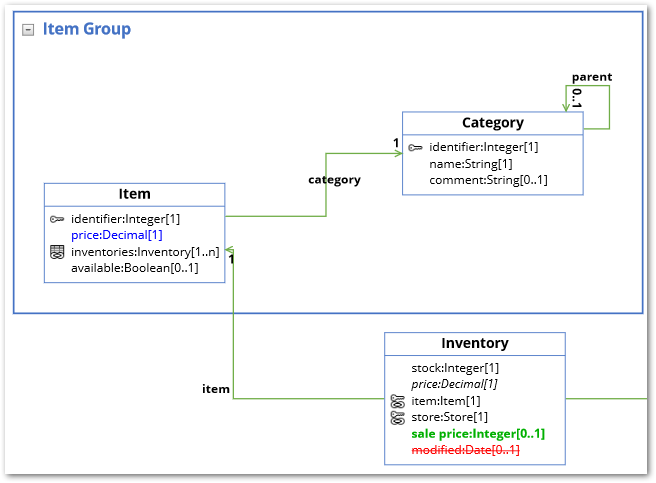
You can save and load data model graphs. When loading a saved graph the add-on can help you visualize changes to model structure. As shown below, updated graphs highlight new items in green, changed items in blue, and deleted items in red (colors may differ depending on configuration):
Model graph API
The EBX Data Model and Data Visualization Add-on's API allows you to generate custom data model graphs from external sources and customize templates to alter look and feel. See Generating a model graph from an external source for more details. Additionally, you can create a custom service from which users can generate a custom data model graph. See Generating from a service for more details.
Data value and relationship graphs
A data value graph is a visual representation of how data values relate to each other. A graph can display relationships between multiple data models. Administrators configure the way relationships render when users run the Display values and relationships service by assigning a display type to each relationship. The table below describes the available types:
| Type | Example and description |
|---|---|
| As Lines | As shown in the following image when you set the display to lines, values display in rectangular nodes and lines between nodes represent relationships. 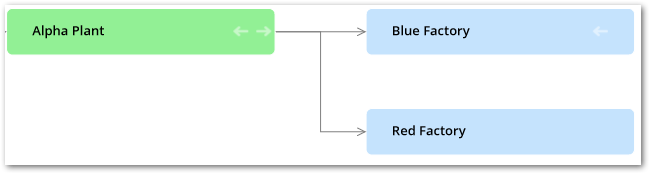 |
| As Containers | As shown in the following image containers show a parent/child relationship as nodes within nodes. Outer nodes are the parents of the smaller, inner nodes. 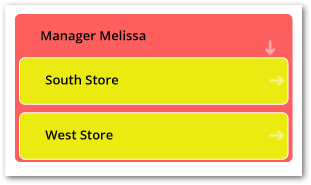 |
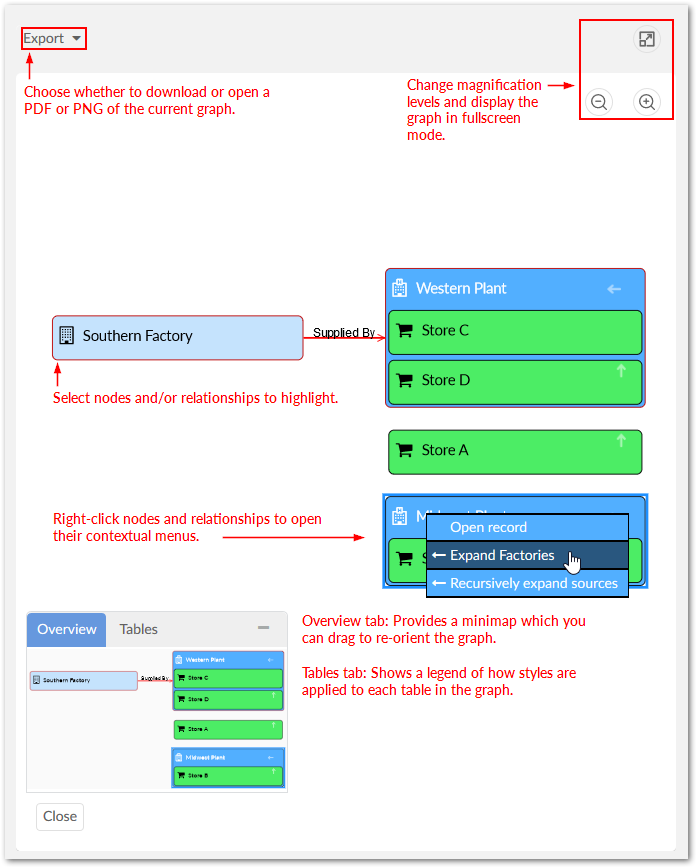
The following image highlights some of the data value and relationship graph features; see Configuring graphs for more details:
Value graph API
The EBX Data Model and Data Visualization Add-on's API allows you to:
-
Generate an existing data value and relationship graph for display in a UI tab. See Data value and relationship graph options for more details.
-
Write a custom service from which users can generate an existing data value and relationship graph. See Displaying a graph from a custom service for more information.
-
Create a custom filter for data value and relationship graphs. See Filtering data values and relationships for more details.
Known limitations
The EBX Data Model and Data Visualization Add-on has the following known limitations:
-
Any saved data model graph based on a duplicated model will refer to the original model and not the duplicated model. Since a saved graph is linked to the XML schema, this behavior is a result of data model duplication not duplicating the schema file name. Embedded models are not affected; only models in modules.
-
If all nodes to expand in a data value graph belong to the same table, the expand service includes the table name. When a table filter is used, the service to expand nodes cannot ascertain the table name to expand. Instead, the following generalized service labels display: Expand targets, Expand sources, Expand children, or Expand parents.
-
After running the Center service on a table, any of its expanded groups are collapsed.
-
The Display data model service is not available in the EBX® Data Modeler Assistant (DMA).
-
Data model graphs are not automatically refreshed to reflect updates to displayed tables and foreign keys.
-
Orphan groups defined at the root of a data model are not displayed in graphs. However, fields defined at this level do display.
-
After resizing a node on a saved graph, the system still displays the default size for the node.
-
Data value graphs do not automatically refresh to reflect updates to displayed data, or nodes.
-
When using the containment type for a self-referencing node, it does not display in the graph.
-
The template configuration cannot be changed at runtime for custom data model graphs—those created using the Java API.
-
In data value graphs, users can move the graph but not graph nodes.
-
On Firefox 52 ESR, performance issues may occur when trying to display a data model graph that includes many tables.
-
Node position is recalculated after expanding. Therefore, node position may change.
-
When a table in a group is hidden, and the group is collapsed, the table's link still displays.
-
Graph templates include the option to show hidden fields, but not hidden tables.
-
Full screen mode is not supported on IE10 or Microsoft Edge.
-
In workflows, no user task is available to run visualization services.
-
The Display data values and relationships service is not available for perspectives.
-
The add-on cannot generate a data value and relationship graph that includes more than 2000 nodes.